A modern car maker builds very little of its own car. Most parts are outsourced to Tier-1 suppliers, and the reusable bins, stillages and dunnage that carry those parts move ceaselessly across company boundaries. Every one of those crossings is a chance for a container to go missing — and at scale, the missing containers add up to one of the largest unmanaged costs on the plant floor.
This article walks through why outsourced automotive supply chains leak returnable containers, what the loss actually costs (with sourced industry figures), how returnable item tracking built on RFID and QR custody recovers it, and how the same record links each container to the material, work order and items inside it for full traceability. To make it concrete we follow a fictional car maker, Meridian Motors, and three of its suppliers — ABC Auto Ltd, DEF Components and GHI Pressings. Names and figures are illustrative; the mechanics and the cited research are real.
The leak nobody owns
At Meridian Motors, roughly 70% of the value of every car arrives from outside the plant. Engine mounts, wiring harnesses, pressings, plastic trim — each shipped in a returnable container designed to do hundreds of round trips. KLT bins, metal stillages, blue-bins and dunnage cycle out to ABC, DEF and GHI loaded with empties, come back full of parts, and go out again.
The problem is custody. The moment a stillage leaves Meridian's gate it sits in someone else's yard, on someone else's truck, inside someone else's process. The plant's records say a container was dispatched; they rarely say it came back. Bins get co-mingled with another customer's pool, used as shop-floor storage at the supplier, stacked in a corner and forgotten, or simply ride away on the wrong truck. No single person owns the return, so the loss is invisible until the year-end count — by which point thousands of containers are unaccounted for.
The consequences are not subtle: emergency container purchases at premium prices, parts that cannot be shipped because there is nothing to ship them in, line-side shortages, and working capital tied up in a "float" of containers that may or may not exist.
What the loss actually costs
Returnable container loss is well documented, and the automotive numbers are stark:
- The automotive sector loses roughly 15–20% of its pallets and lids every year, according to a Deloitte study cited in industry loss research.[1]
- In North America alone, mismanaged reusable packaging and pallets cost the auto industry about ₹6,000 crore (USD ~750 million) a year, per an Automotive Industry Action Group survey.[1][2]
- Across the U.S., total plastic pallet and container loss runs USD 800 million to 1.5 billion annually.[1]
- In India, returnable-packaging analysts estimate annual pallet attrition at around 10% of fleet size, costing industry "millions", as the market shifts from simple asset pooling to data-rich, tracked service platforms.[3]
- Well-run closed-loop systems lose only 1–3% a year; looser systems lose 5–10% — the entire gap is a function of how well custody is tracked.[4]
Individual companies feel it sharply. One U.S. manufacturer was losing effectively 100% of its reusable containers every year before it added tracking — about USD 3.5 million in annual replacements.[1] The pattern repeats wherever containers leave the building without a custody record.
Illustrative example — your figures will vary. Suppose Meridian Motors runs a pool of 18,000 returnable containers averaging ₹7,500 each (a mix of ₹3,000 totes and ₹18,000 stillages). At a "loose system" loss rate of 12%, that is 2,160 containers lost a year ≈ ₹1.6 crore in replacements alone — before counting premium emergency buys, expediting, and the line stoppages a bin shortage can cause. Tighten the loss rate toward the 1–3% of a well-tracked closed loop and most of that number comes back. Model it with your own pool size, container mix and loss rate before committing to anything.
Why ordinary RFID is not enough
Plenty of plants already put RFID tags on containers and still lose them. The reason is that a basic RFID system only answers one question: "what did I read?" It produces a stream of reads. It does not, on its own, tell you who is holding which containers, how long they have held them, and what that outstanding liability is worth.
Returnable item tracking flips the question to "who owes me containers, for how long, and what is it costing me?" That shift — from raw reads to custody and outstanding-liability — is the difference between a dashboard nobody acts on and a system that actually recovers assets.
How returnable item tracking closes the loop
A custody-first system gives every container an identity and then records every change of hands as an immutable event. The building blocks:
- Dual identity on every container (RFID + QR). A rugged UHF RFID tag for hands-free, bulk reads, plus a QR code as a universal fallback any phone can scan — so a supplier with no RFID hardware can still confirm custody. On the India/EU 865–868 MHz band with EPC Gen2v2 / ISO 18000-6C tags such as the REFLECTA MET-A730.
- Automatic gate capture. A fixed RFID reader at the dispatch and receiving docks reads an entire truckload — hundreds of containers — in a single pass and auto-generates the dispatch note. No manual scanning, no clipboard.
- An append-only custody ledger. Every movement is logged like a bank statement that is never edited:
OUT · IN · TRANSFER · LOST · SCRAPPED · REPAIRED. You can always answer "where did this stillage go, and when?"
- Aging and recovery escalation. Each container carries a return clock, colour-coded 0–30 days (green), >30 (yellow), >60 (orange), >90 (red, overdue). Red triggers alerts. This maps cleanly onto the Indian practice of tracking KLT/stillage movements on Rule 55 delivery challans with a per-bin float-aging policy.[3]
- Vendor accountability. A scorecard per supplier — "ABC Auto: 125 bins held, 30 overdue, ₹5.6L at risk, oldest 112 days" — and an external portal where the supplier sees only what they hold and can schedule a return. Accountability stops being an argument over email.
- The recovery digest. Instead of a data dump, management gets a ranked, plain-language headline: "3 vendors hold 47 overdue bins worth ₹5.6L; ABC worst." That is the report that gets containers back.
What it looks like in practice
The screens below show the idea applied to the Meridian scenario — a custody-first portal where the headline is always accountability and recovery, not raw reads. (Container IDs, vendors and figures shown are illustrative sample data.)
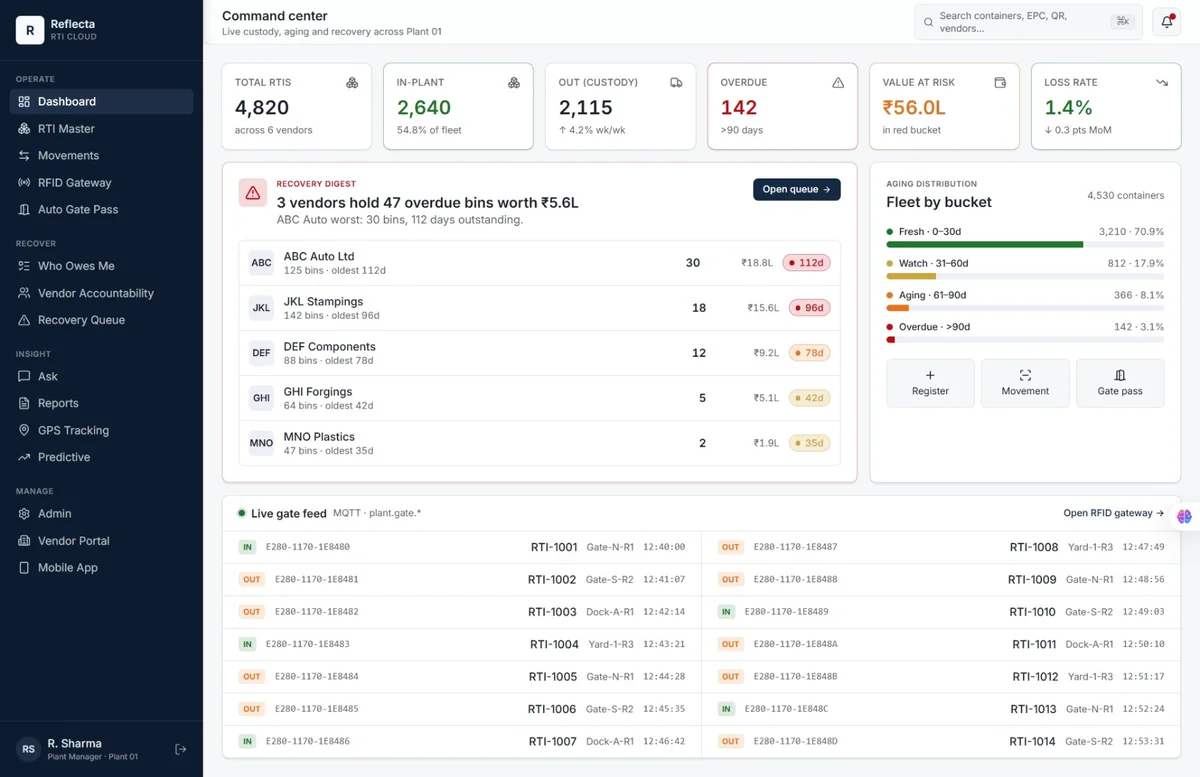 Command center. Fleet size, in-plant vs out-in-custody, overdue count, total value-at-risk and loss rate at a glance — with the recovery digest "3 vendors hold 47 overdue bins worth ₹5.6L" and a live gate feed.
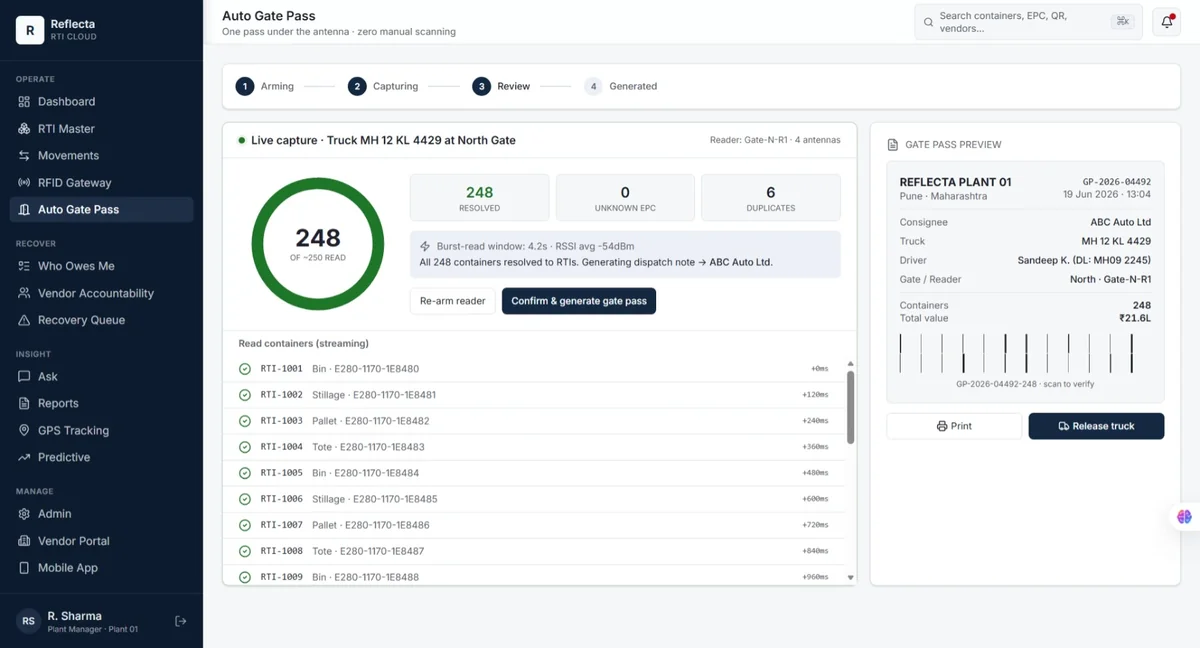 Auto gate pass. A fixed gate reads ~250 containers in one truck pass (248/250 here), resolves each to its RTI, and auto-generates the dispatch note to ABC Auto Ltd — no manual scanning.
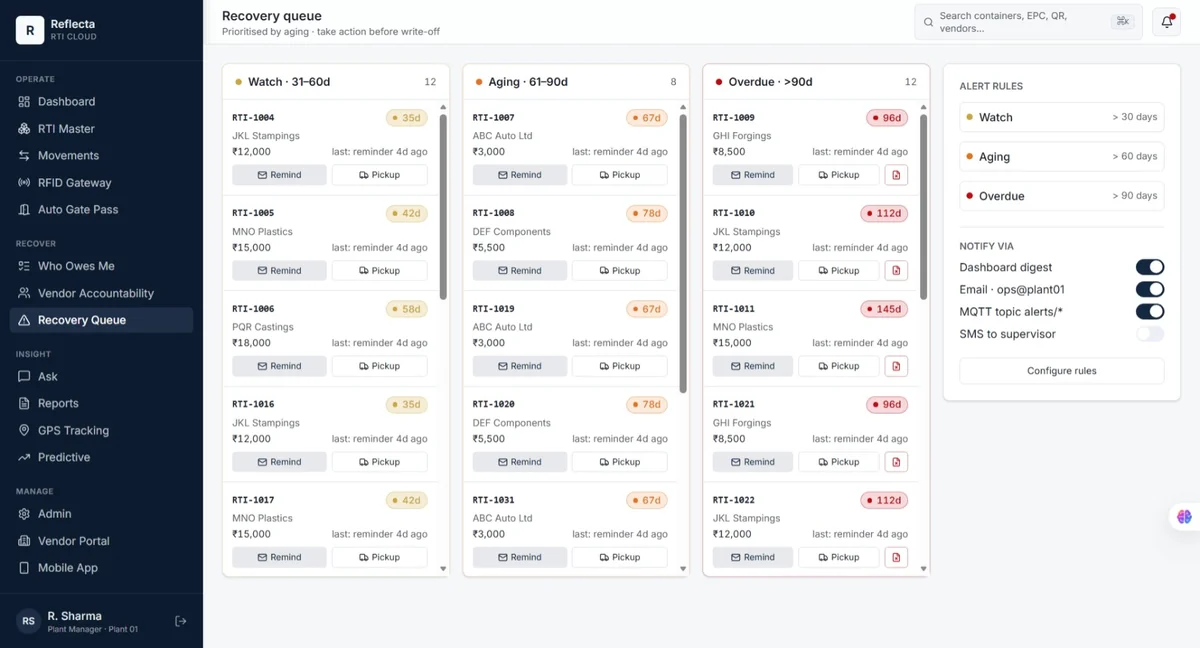 Recovery queue. Overdue containers bucketed Watch / Aging / Overdue (30/60/90 days), each with one-tap "Remind" and "Schedule pickup", plus configurable alert rules and channels.
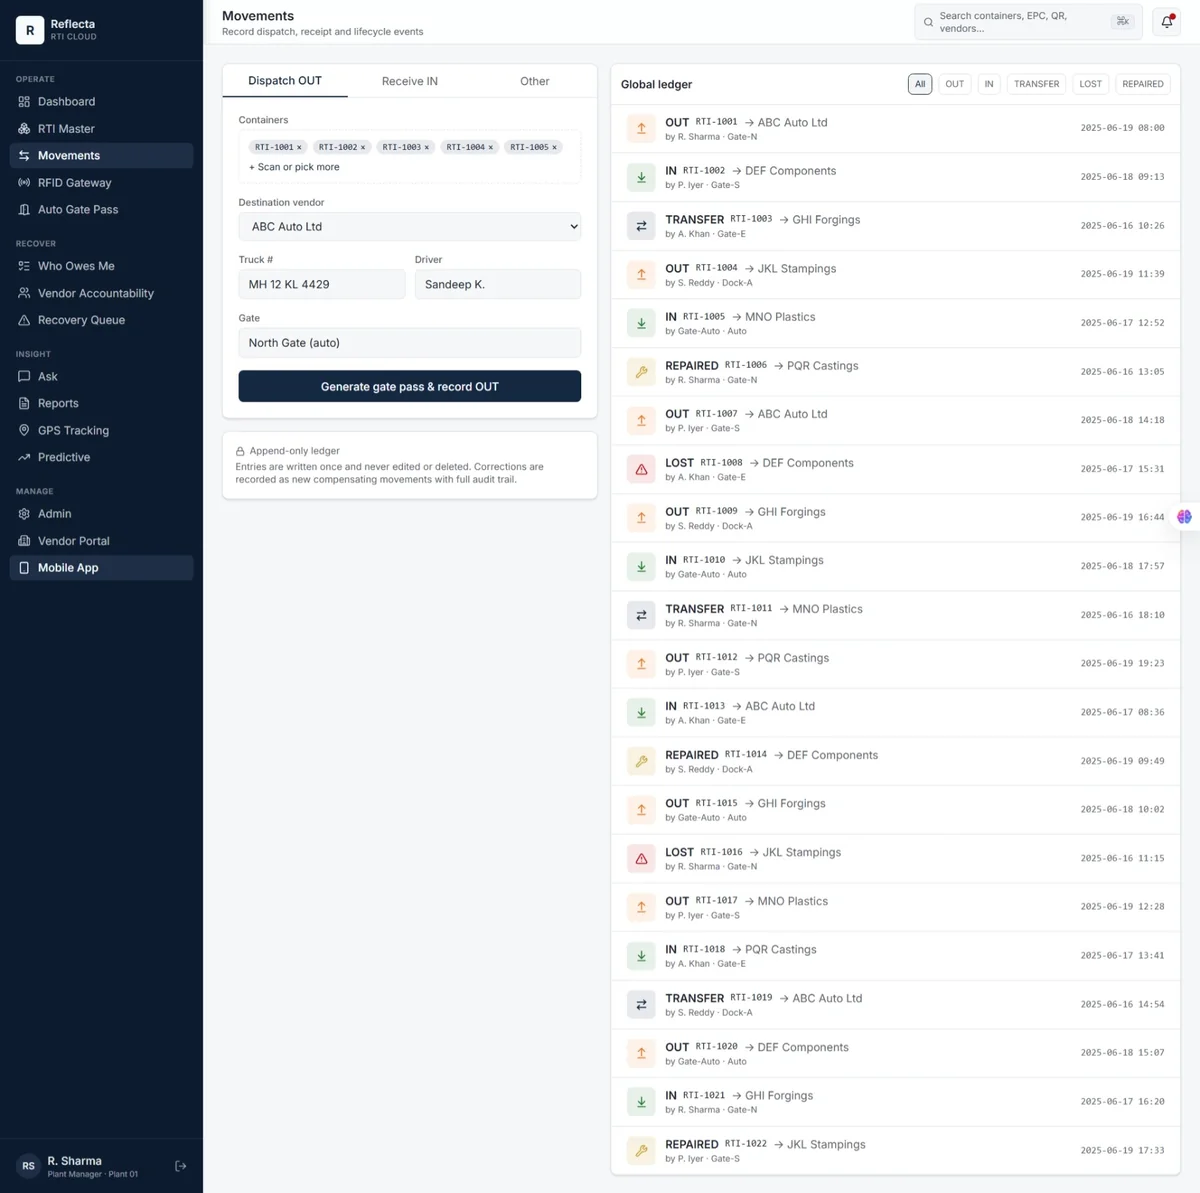 Movements ledger. Every change of hands recorded as an append-only event (OUT / IN / TRANSFER / LOST / REPAIRED) with actor, party, gate and timestamp — never edited, always auditable.
Beyond the container: material, work-order and item traceability
A returnable container is only half the story. The same custody record that tracks the bin can also carry what is inside it — so the system answers not just "where is my stillage?" but "which parts, from which material lot, on which work order, travelled in which container, to which supplier, on what date?" That turns a container-tracking tool into an end-to-end traceability record.
- Material / batch-lot linkage — bind a material or batch number to a container at pack or dispatch, so you can trace exactly which lot went where, and when.
- Work-order association — tie each container to the production or job-work order it serves, and read work-order progress straight from container flow.
- Item / part manifest — record the list of items (part number, quantity) packed in each container; the auto-generated dispatch note doubles as a verifiable manifest at the receiving end.
- Genealogy & recall containment — if a defect surfaces, trace every container — and every supplier, route and date — that carried a suspect lot, and contain the recall to exactly those parts instead of a blanket sweep.
- Job-work & challan compliance — the item manifest plus the append-only custody ledger back Rule 55 delivery challans and job-work returns with line-item detail, not just a bin count.
- FIFO & quality — know not only that a container returned, but what it held and how long the material aged in transit — feeding FIFO discipline and quality checks.
In the Meridian example, a single scan at the ABC Auto gate then tells you the container, its custody, and the work order and part lot it is carrying — one event, full traceability, both ways down the lane.
What plants actually get back
The recovery is measurable, and others have measured it:
- Mobis North America deployed UHF RFID tags and reader portals for real-time visibility of its returnable container fleet, letting it optimise assets, keep parts flowing from suppliers, and avoid buying new containers unless genuinely needed.[5]
- In India's auto corridors, RFID/RTLS pilots on returnable packaging have cut loss incidents by around 30% after rollout.[3]
- Closing the visibility gap moves a fleet from the 5–10% "loose" loss band toward the 1–3% of a well-tracked closed loop[4] — which, on Meridian's illustrative 18,000-container pool, is the difference between losing ₹1.6 crore a year and a small fraction of it.
Beyond the direct recovery, accurate float data answers the question every operations head asks — "how many containers do we actually need?" — and stops the reflex of over-buying to cover a fleet nobody can see.[6]
A pragmatic rollout
The way to de-risk this is to prove it on one lane before scaling:
Phase 1 — one supplier lane (months 1–3).
Pick your highest-volume supplier — say ABC Auto. Tag that container pool with RFID + QR, fit gate readers at the Meridian dispatch dock and the ABC receiving dock, and switch on the custody ledger and aging rules. Baseline the current loss and emergency-container spend on this lane so the pilot has a number to beat.
Phase 2 — accountability and recovery (months 4–6).
Turn on the vendor portal and recovery digest, agree the 30/60/90 escalation with the supplier, and start running the weekly "who owes me" report. This is where the loss rate starts to bend.
Phase 3 — scale across suppliers and plants (months 7–12).
Extend to DEF, GHI and the rest, add auto gate-pass for full truckloads, and feed the float data into "how many containers do we need" planning. By now the custody record is a by-product of normal dock operations, not extra work.
The bottom line
In an outsourced car-manufacturing supply chain, returnable containers are not packaging — they are a circulating capital asset that happens to live mostly outside your walls. Track them like reads and you will keep losing them. Track them by custody and liability — who holds what, for how long, and what it is worth — and the leak closes. For most plants the recovered containers and avoided emergency buys pay for the system well inside the first year.
Frequently asked questions
RTIs are the reusable containers that carry parts between suppliers and the car plant: KLT bins, metal stillages, pallets, totes and dunnage. Each is a reusable asset worth roughly ₹3,000 to ₹18,000, and a single plant can own tens of thousands of them.
Because most parts are outsourced, containers constantly cross company boundaries to Tier-1 suppliers. Once a bin leaves the plant, custody is rarely recorded, so containers pile up in supplier yards, ride out on trucks or vanish in mixed loads. Industry studies put automotive returnable losses at roughly 15–20% of the fleet per year.
Every container is tagged with RFID and QR. Fixed gate readers capture hundreds of bins in a single truck pass and log an append-only custody record (OUT, IN, TRANSFER, LOST). Aging rules flag containers held past 30, 60 or 90 days, and a vendor accountability view shows exactly who owes how many, for how long, and what it is costing — so recovery becomes routine instead of guesswork.
A basic RFID system answers "what did I read?". Returnable item tracking answers "who owes me containers, for how long, and what is it costing me?". Custody and outstanding-liability tracking, not raw reads, is what actually recovers lost assets.
Start with one high-volume supplier lane: tag that container pool, fit RFID gates at the dispatch and receiving docks, and run a 60–90 day pilot measured against a clear baseline of current loss and emergency container spend. Prove recovery on one lane, then scale across suppliers and plants.
Yes. Each container's custody record can be linked to its contents — the material or batch lot, the work order, and an item manifest of part numbers and quantities. That creates an end-to-end traceability record: a single scan tells you the container, who holds it, and which parts and work order it carries — supporting recall containment, FIFO, and job-work or Rule 55 challan compliance with line-item detail.
References
- Packaging Revolution — "The Staggering Numbers for Reusable Packaging and Pallet Loss" (aggregating Deloitte and industry data). packagingrevolution.net
- Auto Industry Action Group (AIAG), reusable packaging loss survey, as cited by McKinsey & Company, "The potential impact of reusable packaging." mckinsey.com
- Mordor Intelligence — "India Returnable Transport Packaging Market" (attrition, Rule 55 challan practice, Pune pilot loss reduction). mordorintelligence.com
- Packaging Revolution / Reusable Packaging Association data on closed-loop vs loose-system loss rates. reusables.org
- Mobis North America returnable container RFID deployment, industry case reporting. industry case
- "Optimal decisions in reducing loss rate of returnable transport items," Journal of Cleaner Production (ScienceDirect). sciencedirect.com
"Meridian Motors", "ABC Auto Ltd", "DEF Components" and "GHI Pressings" are fictional names used for illustration. Figures in the worked example are illustrative planning scenarios, not client results; the cited industry statistics are real and linked above.